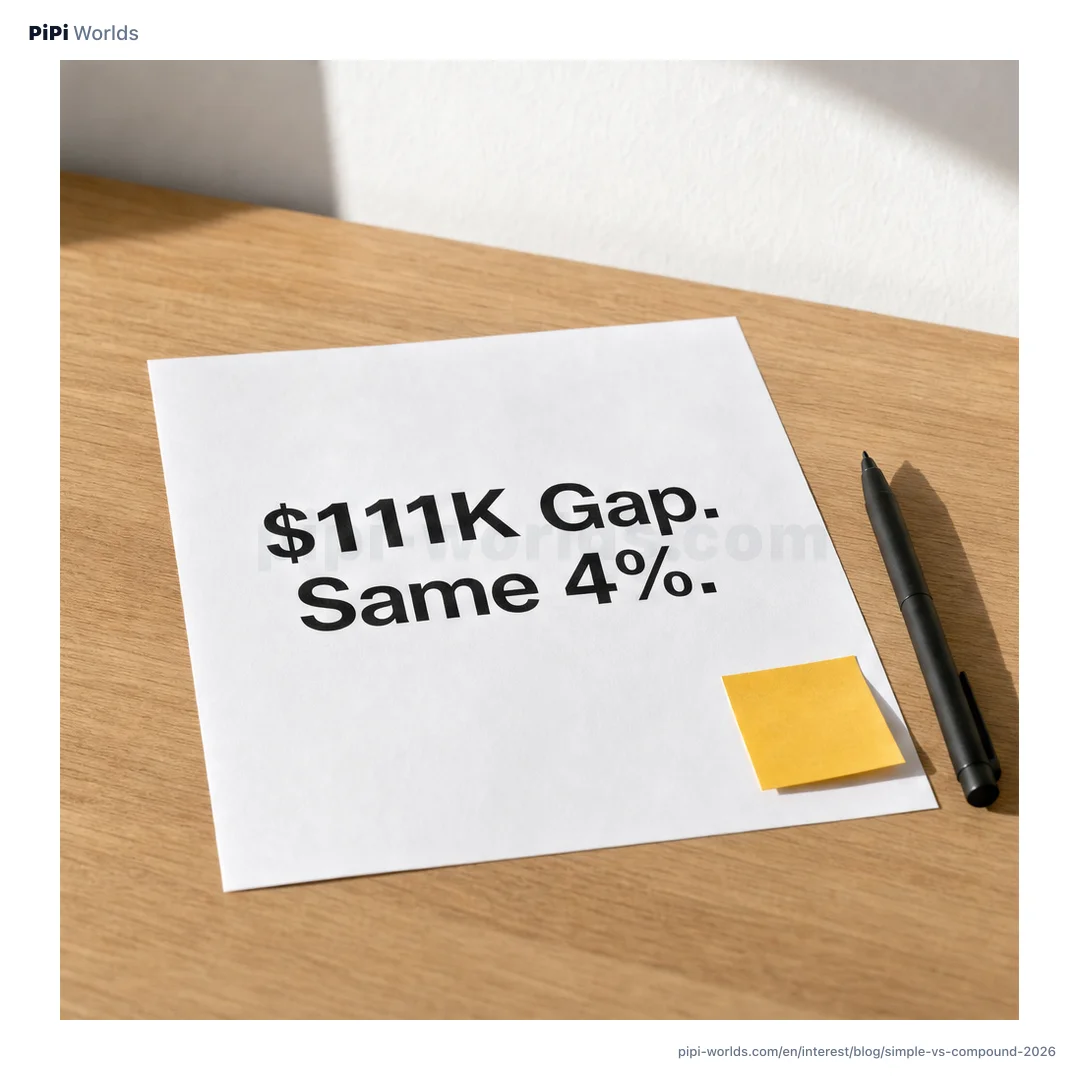
A friend showed me her bank statement last spring. She had parked $100,000 in a five-year CD at 4% APY and ended with about $122,100 in interest at maturity — close to what the bank had quoted on the application. She said it felt smaller than she had expected. The thing is, if she had picked the same $100,000, the same 4%, and the same five years but with monthly compounding instead of simple interest, she would have ended at about $122,100 either way — because most US CDs already compound monthly. But if she had been comparing her CD to her uncle’s annuity, which credits simple interest, the same five years would have left him at $120,000 and her at $122,100. A $2,100 spread that looks small. Run the same toggle for thirty years and the spread becomes $111,000.
The 5-year picture — $100,000 simple vs compound
Simple interest pays you only on what you put in. $100,000 at 4% simple over five years pays $4,000 a year, every year, totaling $20,000 of interest. Final balance: $120,000. A clean straight line.
Compound interest pays you on the interest already earned. The same $100,000 at 4% with monthly compounding adds 0.333% to the balance each month. The next month, that 0.333% applies to the new, slightly larger balance. After sixty months the math is $100,000 × (1 + 0.04/12)^60, which lands at about $122,100.
| Scenario | Simple 4% | Monthly compound 4% | Difference |
|---|---|---|---|
| $100k · 5 yrs | $120,000 | $122,100 | $2,100 |
| $100k · 10 yrs | $140,000 | $149,083 | $9,083 |
| $100k · 20 yrs | $180,000 | $222,258 | $42,258 |
| $100k · 30 yrs | $220,000 | $331,020 | $111,020 |
At year five the gap looks like a rounding error. At year thirty it pays for a starter home in most of the country. Same 4%. Same $100,000. The only thing that changed was time. The compound curve bending up in the table is the shape that the SEC’s Investor.gov compound interest calculator draws on every demo it shows.
Why your bank account barely compounds
Most US checking accounts pay 0.01% APY. Daily compounding on 0.01% over thirty years on $100,000 produces about $300 of interest — barely enough to notice. Compounding does not matter as a math problem at that yield. It matters as a math problem only when the rate clears roughly 1% APY and the term clears roughly ten years.
This is why the high-yield savings account (HYSA) is the standard American compounding vehicle. The major fintech-adjacent banks (Marcus, Ally, Wealthfront, Discover, AmEx) typically advertise APYs in the roughly 3–4% range in 2026, with daily compounding (specific rates change with the Fed’s policy stance, so check the bank’s current disclosure before opening). APY (annual percentage yield) is the regulator-mandated way to express interest, and it already includes the effect of compounding within the year. APR (annual percentage rate) does not. When two products show “4%,” the one labeled APR will compound to less than the one labeled APY.
The SEC and FDIC require APY disclosure on deposit products specifically because compounding frequency is otherwise easy to hide. A “4% monthly” CD shows 4.074% APY. A “4% daily” HYSA shows 4.081% APY. The customer-facing comparison should always be APY against APY.
Where compounding becomes exponential — index funds, 30 years
The real home of compounding is the thirty-year container: a Roth IRA, a traditional 401(k), an HSA after age 65, a taxable brokerage account holding broad index funds. The S&P 500 has averaged roughly 10% nominal and 6–7% real over rolling thirty-year windows. Compound those numbers and the curve goes vertical.
Run $100,000 at 7% (a conservative real return assumption) for thirty years. Simple at 7% finishes at $310,000. Monthly compound at 7% finishes at $811,650. The gap is $501,650. Run it at 10% nominal and the simple line lands at $400,000 while the compound line lands at $1,983,740 — a $1,583,740 gap. Steeper rate, steeper curve, wider gap.
This is why financial planners spend so much air time on tax-advantaged accounts. The IRS treats interest income as ordinary income — see IRS Topic 403 — and every dollar that goes to taxes never comes back to compound. Roth IRAs, 401(k)s, and HSAs each shelter compounding from the IRS in different ways, and the difference shows up at the tail end of the curve, not the front.
There is one wrinkle worth pulling out: expense ratios. A 4% gross return minus a 1% expense ratio compounds at 3% net, finishing at $242,700 over thirty years on $100k. The same 4% gross net of a 0.05% index fund expense ratio finishes at about $327,500. One percentage point of fees costs $84,800 over thirty years on a single $100,000 deposit. That is the entire reason index investing exists.
The Rule of 72 — 4% doubles in 18 years
The fastest mental shortcut for compound math is the Rule of 72. Divide 72 by your annual rate. The result is the doubling time in years. 4% doubles in 18 years. 6% doubles in 12. 8% doubles in 9. 12% doubles in 6.
| Rate | Rule of 72 | Exact (ln 2 / ln(1+r)) |
|---|---|---|
| 2% | 36 yrs | 35.0 yrs |
| 4% | 18 yrs | 17.67 yrs |
| 6% | 12 yrs | 11.90 yrs |
| 8% | 9 yrs | 9.01 yrs |
| 10% | 7.2 yrs | 7.27 yrs |
The exact formula uses natural logs but the rule stays within 1% across normal rates, which makes it the right tool for back-of-the-napkin work. The Rule of 72 entry on Wikipedia covers the derivation if you want it. At 4% your money doubles every 18 years, so $100,000 reaches $200,000 by year 18, $400,000 by year 36. Run the rule on 30 years at 4% and you should be near $360,000 — the actual compounded value is $324,300, close enough that the rule earns its keep.
After tax (24% federal + state) — the real gap
US interest income is taxed as ordinary income. For a household in the 24% federal marginal bracket with a 5% state rate, every dollar of interest income returns about 71 cents after tax. Apply that drag to the compound curve and it stops growing in the same shape.
Take the $100,000 at 4% monthly compound over thirty years. Before tax, the final balance is $331,020, of which $231,020 is interest. Apply 29% combined tax annually to the interest as it accrues and the effective rate becomes about 2.84%. Recompute thirty years and the balance lands at about $233,400 — still solidly above the simple-interest result, but $97,600 lower than the pre-tax compound number. The simple-interest after-tax balance comes out to about $185,800. The after-tax compound-vs-simple gap is $47,600 instead of $111,020.
Tax drag matters more for compounding than for simple interest because every dollar lost to tax is also a dollar that no longer earns future interest. Sheltered accounts — Roth IRAs, 401(k)s, HSAs — exist precisely because of this asymmetry. A more thorough treatment of US tax mechanics on deposits is in our after-tax deposit yield breakdown.
Three markets, three compounding cultures
The default compounding behavior is different in different markets.
| Market | Checking | Savings (HYSA) | CD / TD | Tax |
|---|---|---|---|---|
| US | daily | daily | daily | ordinary income (22–37% federal + state) |
| Korea | simple | simple (monthly compound option) | simple by default | 15.4% flat |
| Japan | simple (paid semiannually) | simple (3+ year: semiannual compound) | simple by default | 20.315% flat |
The US has the most aggressive compounding defaults — daily across the board, plus mandatory APY disclosure. Korea ships products as simple-interest by default, with monthly-compound as an opt-in. Japan defaults to simple interest paid semiannually; semiannual compounding only applies to longer-term time deposits (typically 3+ years), and yields are so low (often 0.001%) that the effect is invisible either way. Same word, different shape of curve.
For US savers the practical implication is to chase APY, not APR, and to push as much principal as possible into tax-sheltered compounding accounts. Adjusting for inflation sharpens the picture further: a nominal 4% compound becomes a real 1% compound when inflation runs at 3%, and the curve bends much less steeply once you measure in purchasing power.
Tool — toggle once, see both curves
The PiPi Worlds interest tool plots the simple-interest line and the compound-interest curve on the same chart. Enter principal, term, and rate; toggle annual, monthly, or daily compounding; the curves redraw instantly. Final balance, total interest, and after-tax figures all sit on one screen so the divergence is visible at a glance — small at year five, dramatic at year thirty.
There is no need to compute (1 + 0.04/12)^360 by hand, and no need to retype every input when switching between simple and compound. The toggle does that work.
Spend thirty seconds on the interest tool and find the date your own savings cross their first major doubling. The result URL updates as you type, so you can bookmark it or share it with a partner who is staring at the same retirement math.
Two numbers worth memorizing as you walk away from this post: at 4% over five years, simple and compound are basically the same — about $2,100 apart on a $100,000 deposit. At 4% over thirty years, the same toggle is worth $111,020. Same rate. Same principal. The only variable is the calendar. Simple versus compound is one of those concepts everyone learns once in school and almost no one revisits afterwards, but it is the single most consequential checkbox on most retirement-account application forms. The shape of your next thirty years runs through it.